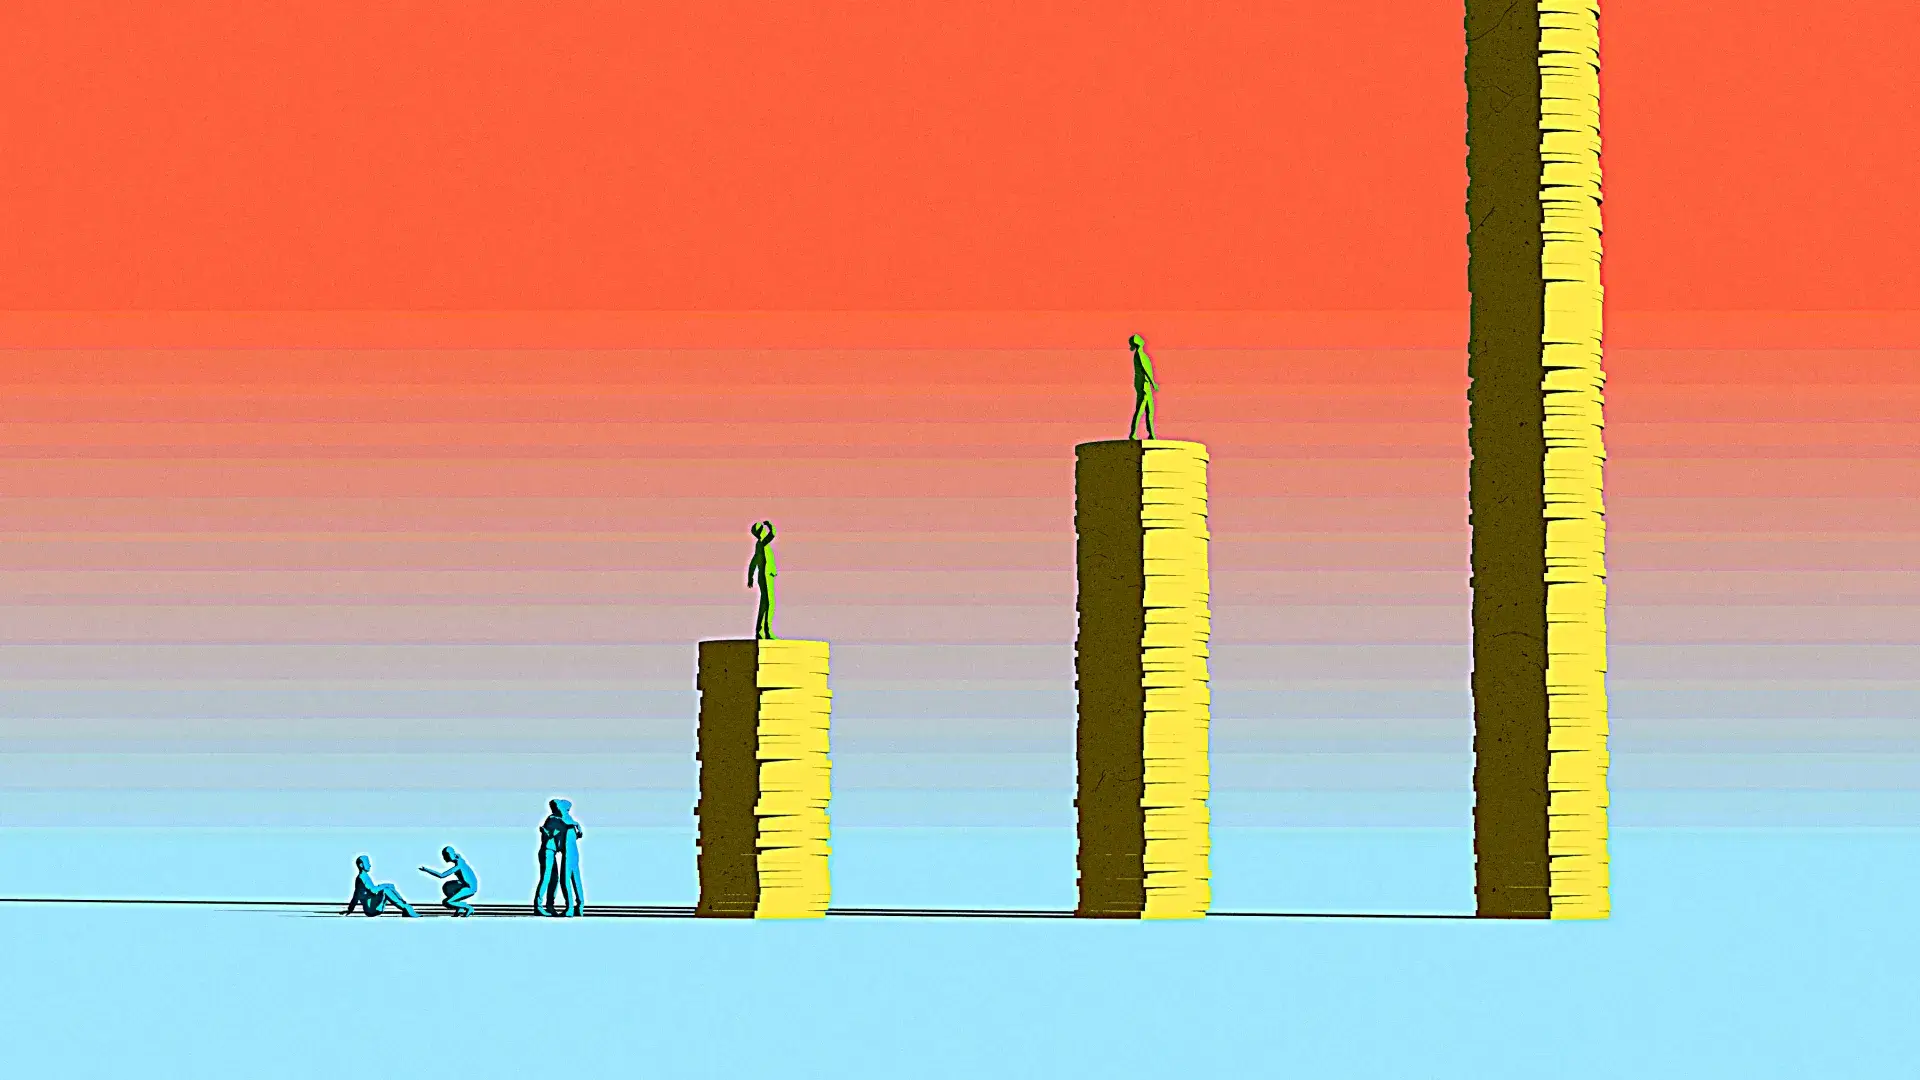
In the past 40 years, globalization has transformed our world, sparking unparalleled growth but also revealing deep-seated inequalities in its wake.
The increasing interconnectedness of economies, societies, and cultures has fuelled a boom in trade, investment, and innovation, leading to unprecedented levels of growth and development. The reach of multinational corporations has expanded globally with the aid of new technologies, while emerging economies - regions once overlooked - have risen to become important actors in the global economy.
Central banks and other monetary institutions in the West frequently advocate the advantages of globalization, such as improved living standards, increased availability of goods and services, and broader prospects for economic and personal growth. However, the fruits of globalization have not been distributed equally among all individuals and countries.
We often hear that everyone is getting richer, but who has actually reaped the economic benefits of globalization?
To tackle this question, we will start by analysing the elephant graph. The graph depicts how income growth has been distributed across various percentiles of the population worldwide since 1980. The graph gets its name from its shape, which resembles an elephant with a long tail.
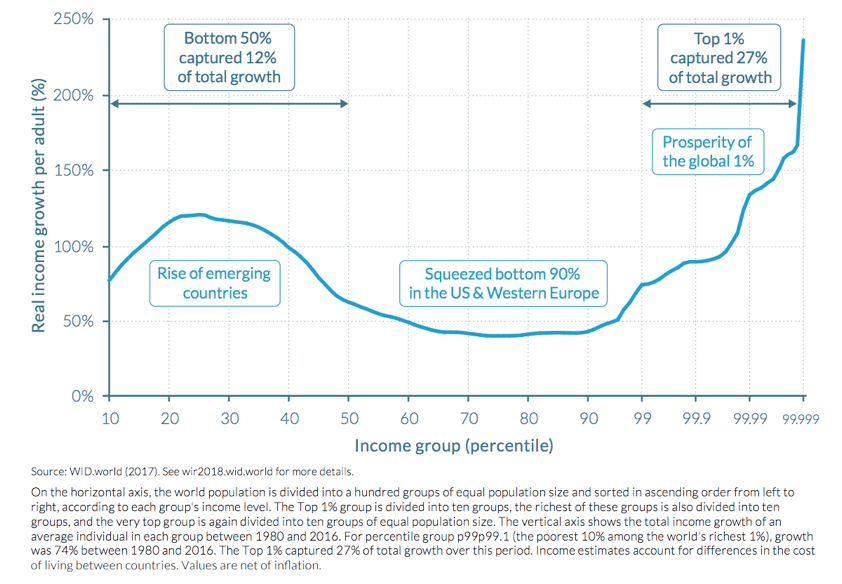
What exactly does this graph depict?
The answer is quite clear: the winners of globalization are the emerging middle class in Asian countries (China, India, Thailand, Vietnam, etc.), as well as the top 1% of income earners. They have collectively obtained the majority of the income growth that globalization has facilitated. In contrast, the (lower) middle class in Western Europe and the US have been the losers of globalization.
Over the past four decades, numerous Asian economies have gone from irrelevance to the world’s primary manufacturing hubs, thanks to globalization fuelling outsourcing and increasingly intricate supply chains. This development has fostered the emergence of a middle class that was previously absent in these nations.
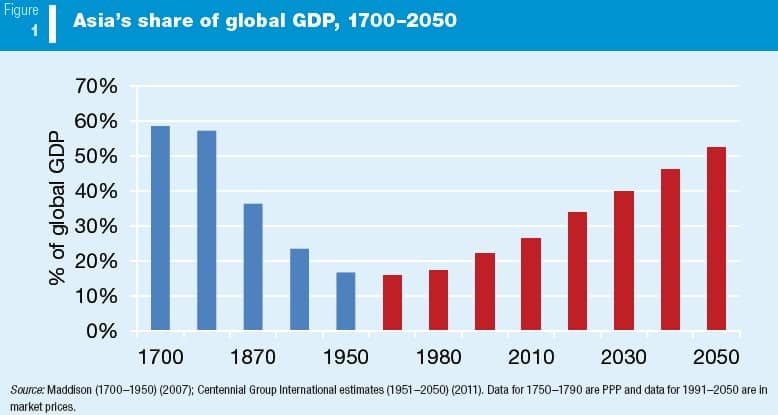
The remarkable economic influence and growth of the Asian region have been a noteworthy trend, causing some economists to refer to the upcoming years as the "Asian Century". Economists and scholars suggest that the Asian century is only in its early stages, as demonstrated in the chart below.
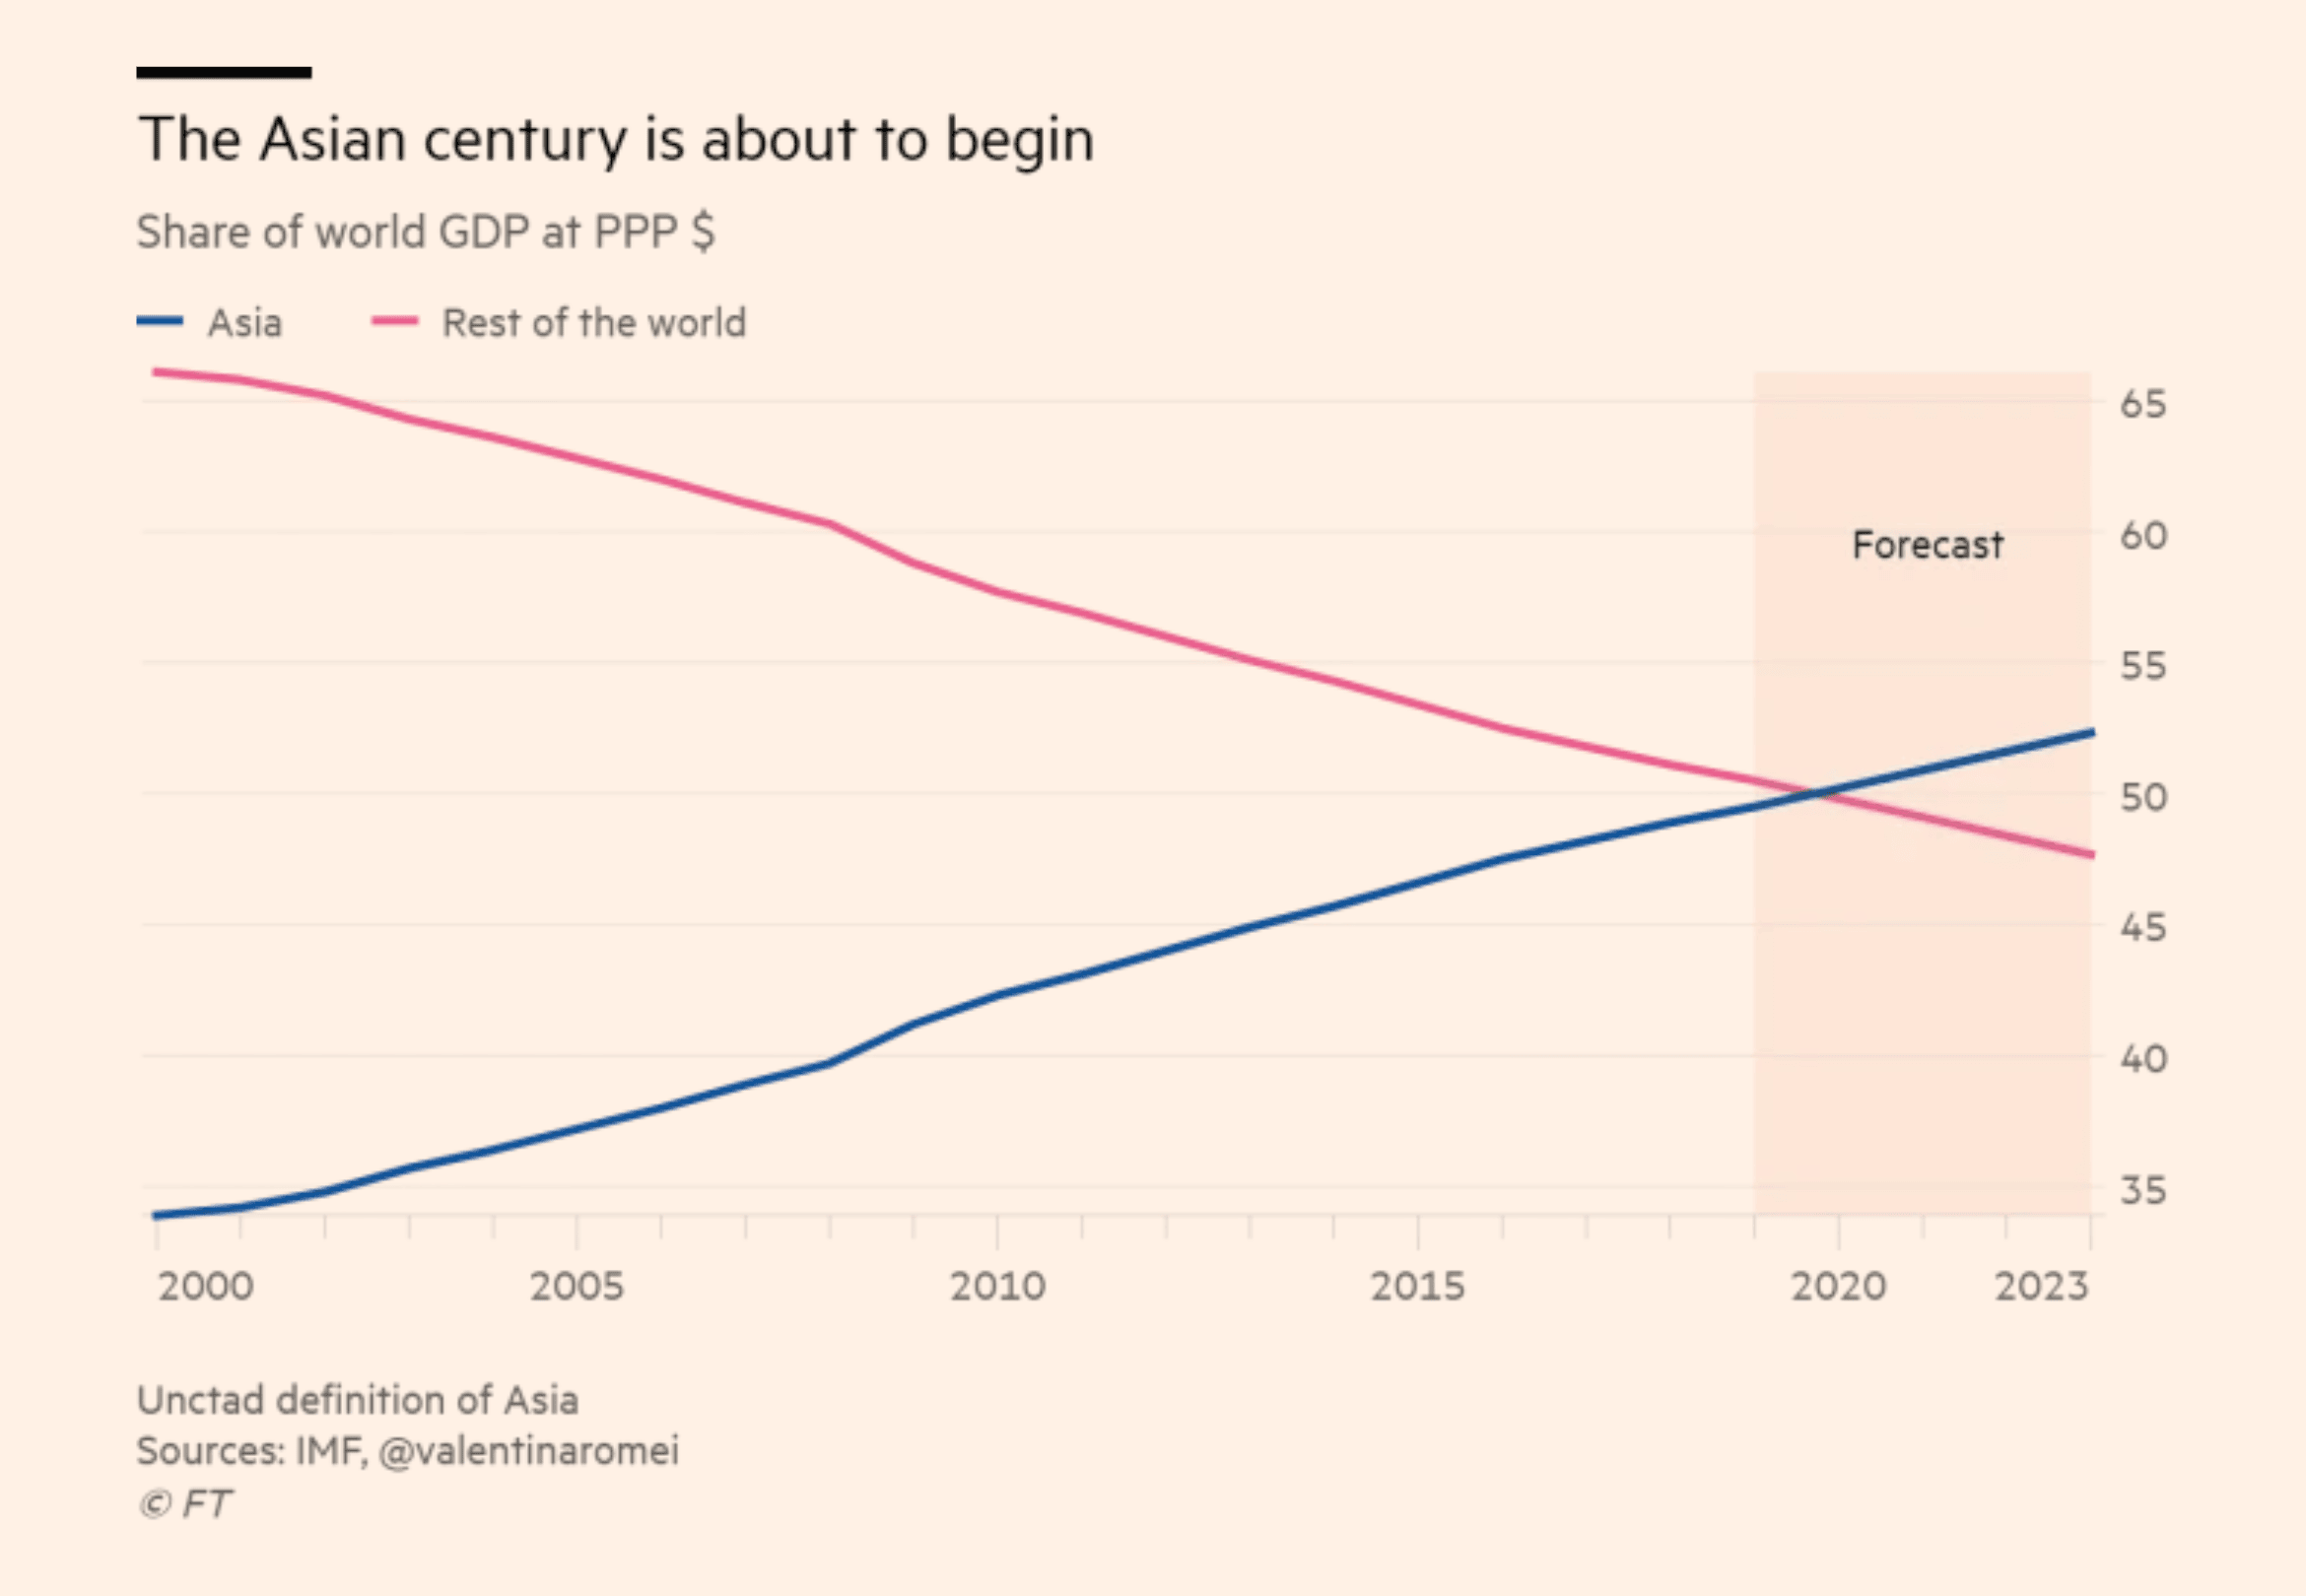
Over the past decade, the Asian share of global GDP has risen from 38% to 45%, with a forecast of exceeding 50% by 2030, and possibly even earlier. The Asian economies will soon surpass the US and Europe, marking an unprecedented economic milestone that will have significant geopolitical implications in the coming decades.
But the winners of globalization do not only include the Asian economies. The top 1% of earners have captured a staggering one-third of all income growth since the 1980s. The wealthiest 1% hold a vast majority of the world's resources, with the richest 0.1% controlling even more, and the richest 0.001% holding an even larger share. It seems that money rises to the top like a hot air balloon.
This is not a coincidence. Have you ever played the game of Monopoly? If so, you know that no matter how many people start playing, it always ends up with just one person having all the money. This is not arbitrary, but the inevitable consequence of multiple trades that are conducted randomly. This will always happen - it is just a matter of time.
Here is another example. Imagine you and a group of friends each start with $50 and play a game where you flip a coin against each other. The winner takes a dollar from the loser. What do you think happens? You guessed it – eventually, one person ends up with all the money.
This is somewhat of a natural law, which indicates that the concentration of wealth is a deeply ingrained feature of creative production systems. It's like a natural force that governs how things work.
Now, you might think that this only applies to money, but that is not true. In reality, it applies to every creative field where there is a variation in production levels. This includes the number of records produced and sold, as well as the number of compositions written.
For instance, in classical music, five composers - Beethoven, Bach, Brahms, Tchaikovsky, and Mozart - have produced the music that occupies 50% of the classical repertoire. The distribution of city sizes and the number of hockey games scored also follow this pattern.
This is what is referred to as Price’s law, a law stating that half of the work comes from the square root of all workers (see the graph below). In layman’s terms, a small number of people in a given field asymmetrically outproduce other people (just like the classical music example).
Alfred J. Lotka made a similar contribution with what is known as Lotka's law. Although the mathematical formula differs somewhat, the conclusion is the same: in systems of creative production (most work domains today), a few individuals make the majority of contributions, just like a few individuals hold the majority of the money.
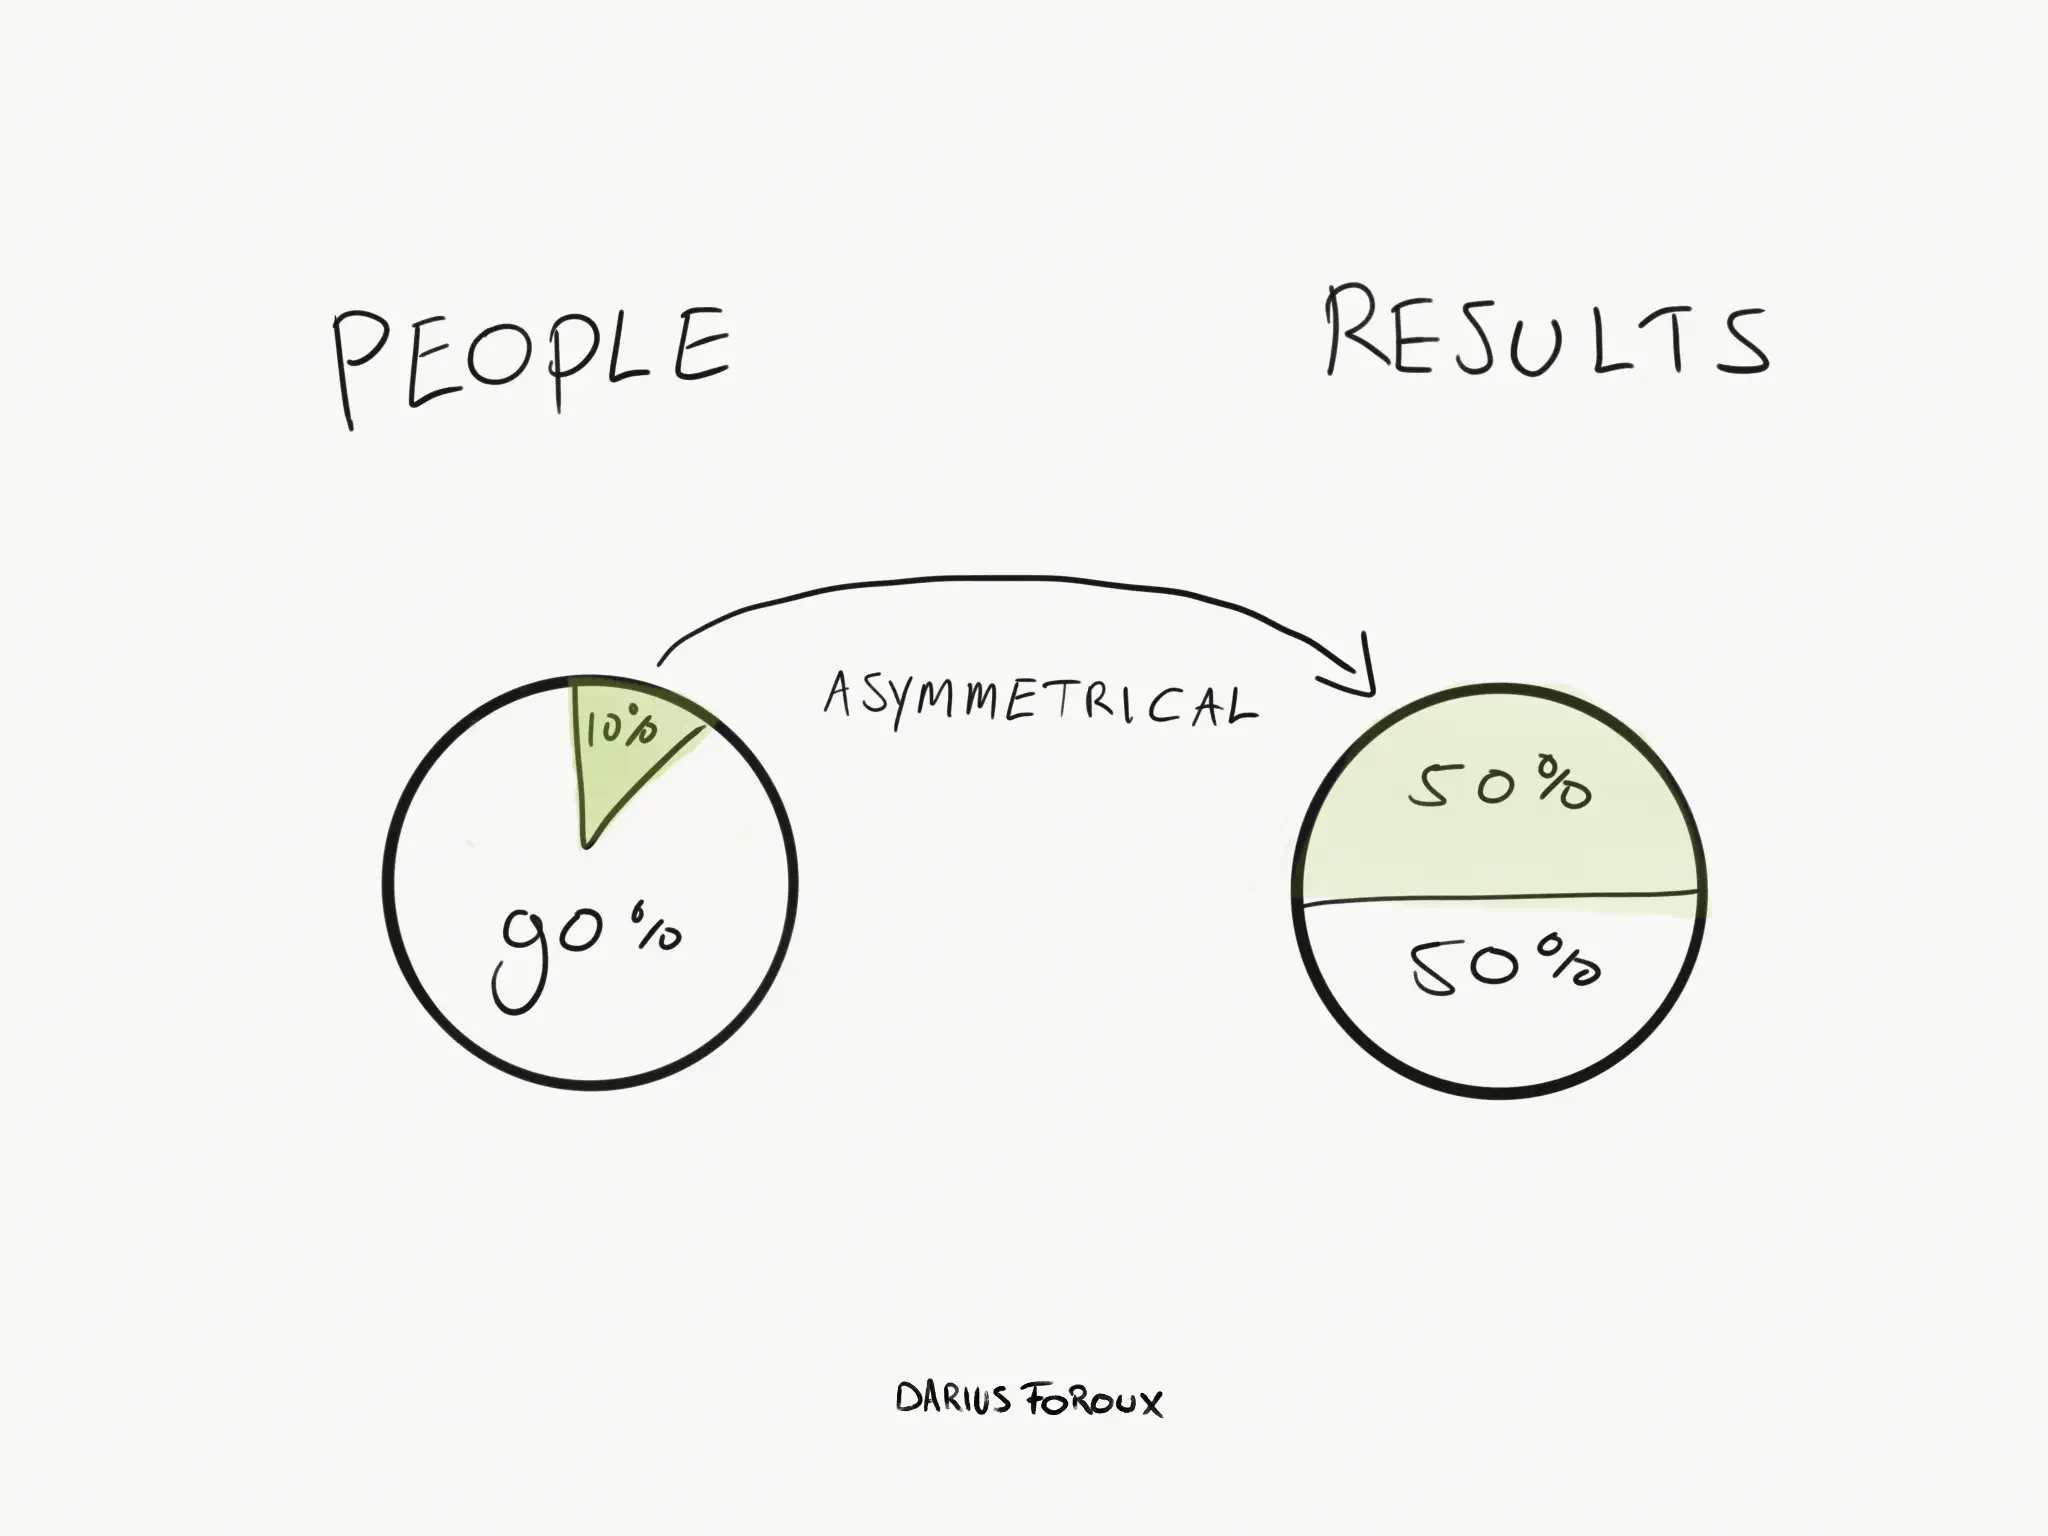
Similarly, Vilfredo Pareto popularized the Pareto distribution, a power-law probability distribution that he employed to showcase the distribution of wealth in Italy via the "80-20 rule". That is, 20% of the population owns 80% of the wealth and vice versa.
This principle holds true even today, as studies conducted in 2007 in the US revealed that the top 20% of Americans owned 85% of the nation's wealth, while the remaining 80% owned just 15%, further affirming the empirical validity of the Pareto distribution. Although the wealth of the top percentile varies, it is typically correlated to the stock market and tends to rebound after falling.
Both Lotka and Price’s law as well as the Pareto distribution indicate that the concentration of wealth (outcome) is a deeply ingrained feature of creative production systems. Therefore, the real challenge lies in finding a way to redistribute resources from the minority who controls almost everything to the majority, who own little to nothing. Unfortunately, there is no simple solution, as reallocating money downward tends to result in it moving back up again.
In conclusion, globalization has brought unprecedented growth and prosperity to the world, but it has not been distributed equally. The main beneficiaries have been the top 1% of income earners and the emerging middle class in Asian countries. The unequal concentration of wealth at the top is not a mere coincidence, but rather an inherent characteristic of creative production systems, as demonstrated by Price's law, Lotka's law, and the Pareto distribution.
Moreover, Asian economies have reaped the benefits of globalization in the past 40 years, becoming the world’s manufacturing hub. This has skewed the proposition of GDP to their advantage and started the "Asian Century". In contrast, the elephant graph suggests that the lower-middle class in Western Europe and the US has primarily experienced the negative effects of globalization, characterized by sluggish income growth and increasing dissatisfaction.
